 I
I
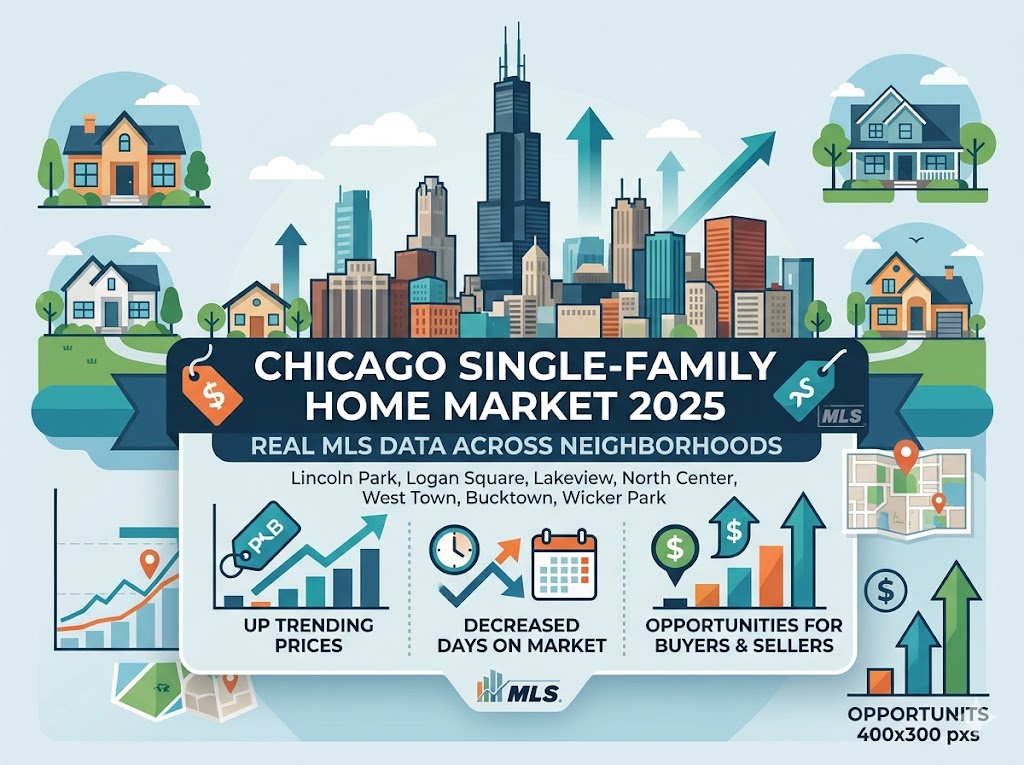
f you're thinking about buying or selling a single-family home in Chicago, there's no substitute for looking at what's actually happening on the ground — street by street, neighborhood by neighborhood. The data below covers detached single-family activity across ten of Chicago's most active markets since March 2025. What emerges is a city of distinct micro-markets, each with its own tempo, price point, and buyer profile. Here's what the numbers tell us.
Lincoln Park: Chicago's Most Expensive Single-Family Market
Lincoln Park remains in a category of its own. Over the past year, 175 homes sold with a median sale price of $2.39M and an average of $2.67M — representing over $467 million in total volume. Average market time was 65 days, and the luxury tier performed remarkably: 23 homes in the $4M+ range sold, with 8 closing above $5M.
Demand is clearly sustained at the top. Currently 23 homes are under contract with a median list price of $2.775M and an average of nearly $2.95M. The active pipeline skews even higher — 20 listings are on the market with an average ask of $4.17M and a median of $3.22M, though some of those have been sitting considerably longer. For sellers in the $1M–$3M range, conditions are favorable. Above $5M, patience is required.
Lake View: Deep Liquidity at the Upper-Mid Tier
Lake View punches hard in volume. 120 single-family homes sold in the past year with a median price of $1.85M and an average of $1.94M, totaling over $233 million. The $1M–$2M bracket drove the market with 59 sales, while the $2M–$3M range produced 38 closings — a sign that buyers are willing to stretch here for the right property.
Average market time was 56 days overall, but the pipeline is active: 14 homes are under contract with a median list price approaching $1.94M and an average of $2.22M. For buyers, 12 active listings are currently available with a median ask of $2.9M and an average above $3.3M — suggesting the current listing pool skews toward larger, more premium homes. Well-priced product in the $1.5M–$2.5M range continues to move efficiently.
North Center: Consistent, Competitive, and Deep
North Center is one of the most consistent performers in the city. 157 homes sold over the past year with a median of $1.7M and an average of $1.70M — nearly identical figures — suggesting a well-calibrated market with limited overpricing. Total sales volume reached $266 million, and average market time was just 44 days.
18 homes are currently under contract with a median list price of $1.85M, and the active inventory is lean — only 9 listings on market with a median ask of $2.2M and an average market time of 84 days. For sellers: if you're priced in the $1.5M–$2.5M sweet spot, this market is working. For buyers: move quickly when something new comes on.
Logan Square: The Highest Volume Market in This Report
Logan Square led all neighborhoods in transactions. 192 single-family homes sold in the past year — more than any other neighborhood in this report — with a median sale price of $1.144M and an average of $1.17M, generating over $225 million in total volume. Average market time was just 35 days, the second-fastest in this group.
The $1M–$2M bracket dominated with 99 sales, while the $900K–$999K range saw 13 homes close in an average of just 8 days — that price point is clearly where buyer demand is sharpest. Currently 19 homes are under contract with a median list price of $1.05M. Logan Square continues to attract buyers looking for character, walkability, and value relative to Lincoln Park and Lakeview.
West Town (Bucktown / Wicker Park): Strong Volume, Wide Range
West Town — encompassing Bucktown and Wicker Park — delivered impressive breadth. 179 homes sold over the past year with a median of $1.3M and an average of $1.33M, for a total of over $238 million in volume. Average market time was 48 days, and the $1M–$2M tier accounted for 115 of those sales.
The market spans a wide spectrum — sales ranged from $275K to $4.55M — which speaks to the neighborhood's diversity of housing stock, from coach houses and vintage two-flats to new construction luxury homes. 19 homes are currently under contract with a median list price of $1.6M. Active listings skew higher and have been sitting longer, with an average of 231 days on market for the 15 currently active homes — suggesting sellers at elevated price points need to be strategic.
Explore Wicker Park listings →
Lincoln Square: Speed Is the Story
Lincoln Square is where well-priced homes disappear fast. 71 homes sold over the past 12 months with a median of $1.03M and an average of $1.17M — and the overall average market time was just 31 days, the fastest of any neighborhood in this report.
The $700K–$999K range was particularly brisk, with homes in those brackets averaging 6 to 13 days on market. Even at the higher end, the $2M–$3M tier averaged only 37 days to close. For buyers, this neighborhood rewards preparation. For sellers, the data suggests that pricing at or just below market brings swift, competitive results.
Edgewater: Efficient Market, Attractive Entry Points
Edgewater offers a compelling combination of price accessibility and speed. 46 homes sold in the past year with a median of $947,500 — the lowest median of the lakefront-adjacent neighborhoods — and an average market time of just 34 days. The $600K–$799K range was the most active, with 8 sales averaging only 19 days on market.
At the upper end, 18 homes closed in the $1M–$2M range and 3 above $2M, reaching as high as $2.6M — a reminder that Edgewater supports a full price spectrum. Currently just 4 homes are active with very low average market time of 17 days, suggesting inventory is extremely tight. Buyers should be ready to move.
Uptown: Tight and Decisive
Uptown's single-family market is small but remarkably efficient. 34 homes sold in the past year with a median of $1.387M and an average of $1.405M, and an average market time of 46 days. The $800K–$999K range moved fastest, with those homes averaging just 7 to 9 days to close.
Only 5 active listings currently exist, with a median ask of $2.575M and an average market time of 68 days — most of that inventory is concentrated at the upper end. For buyers wanting Uptown at a more accessible price point, inventory is essentially nonexistent right now.
Near West Side: More Affordable, More Patient
Near West Side offers the broadest price range and a more deliberate pace. 25 homes sold over the past year at a median of $615K and an average of $605K — well below the other neighborhoods in this report. Average market time was 83 days, and the $700K–$799K range led all price brackets with 7 sales averaging 133 days.
3 homes are currently under contract with a median list price of $800K. This is a market for patient buyers willing to navigate a wider range of property conditions and a longer timeline — but the price point relative to neighboring West Town is notable.
Explore Near West Side listings →
Near South Side: Limited But Luxury
Near South Side had the fewest transactions of the group but among the highest prices. 6 homes closed in the past year, with a median sale price of $1.237M and an average of $1.388M — all within the $1M–$2M range, averaging 67 days on market. 1 home is currently under contract at $1.175M. This is a thin, specialized market — when the right property comes along, serious buyers should be ready.
The Macro Takeaway
Across all ten neighborhoods, the data reveals a few consistent truths for 2025–2026:
Well-priced homes sell quickly — Lincoln Square at 31 days and Logan Square at 35 days prove that the North Side market rewards accurate pricing. Luxury product requires more patience, particularly above $4M in Lincoln Park and above $3M in Lakeview, where some listings have been sitting for several months. And inventory remains lean across the board — total active listings across all ten neighborhoods combined barely exceeds 90 homes, which means buyers have limited selection and sellers of move-in-ready product remain in a strong position.
Whether you're trying to time a move, understand what your home is worth, or identify where your dollar goes furthest right now, the neighborhood-by-neighborhood picture matters enormously.
Ready to Talk Through What This Means for You?
Every buyer and seller situation is different — and so is every block. I'd love to help you interpret what these numbers mean for your specific home, your target neighborhood, or your timeline.
Request Your Free Home Valuation →
Considering a move in any of these neighborhoods? Reach out directly — I'm happy to share what I'm seeing beyond what the data shows.
About Anne Rossley
(Insert headshot here)
Anne Rossley is a Chicago-based real estate broker specializing in the city's most sought-after neighborhoods, historic architecture, luxury properties, and buyer and seller strategy across Chicago's North Side and beyond. Learn more about Anne →
Keep Reading
- Single-Family Home Market: Lincoln Park, Lakeview & Uptown Breakdown
- What to Fix, Update, and Do Before Listing Your Chicago Home
- Chicago Historic Architecture & What Buyers Need to Know